To the Editor:
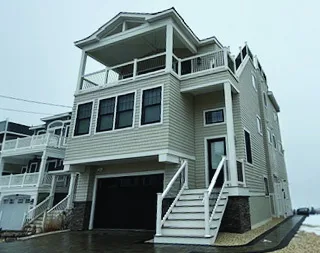
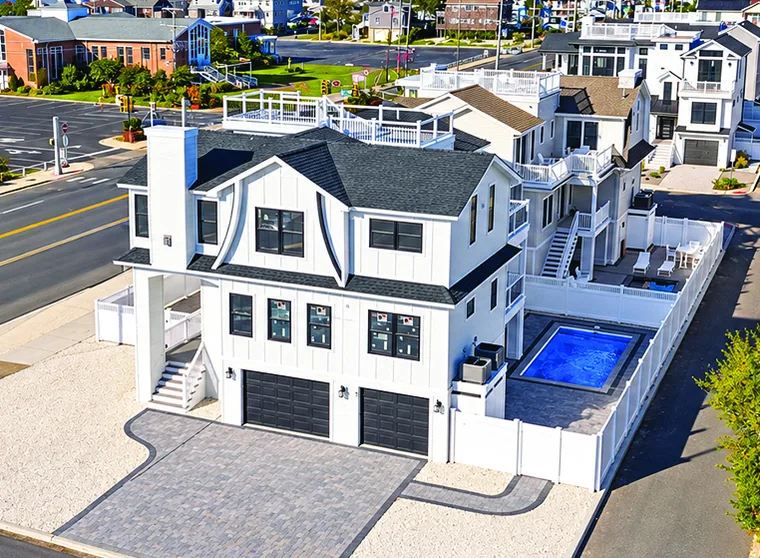
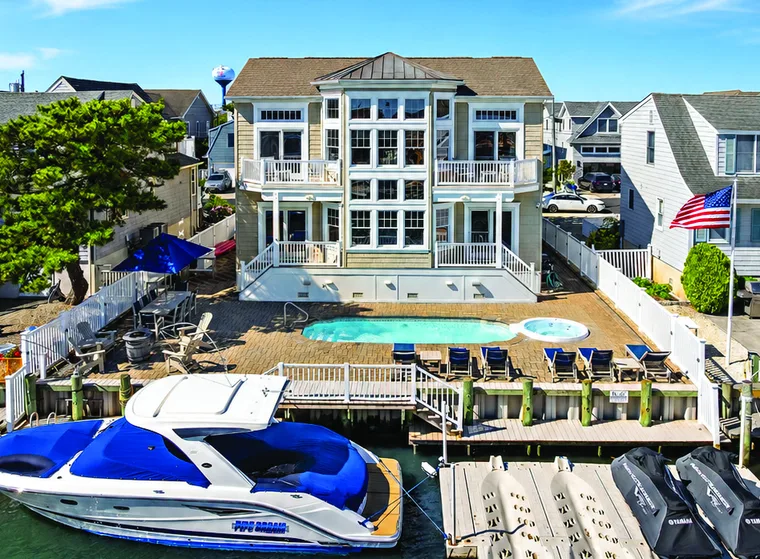
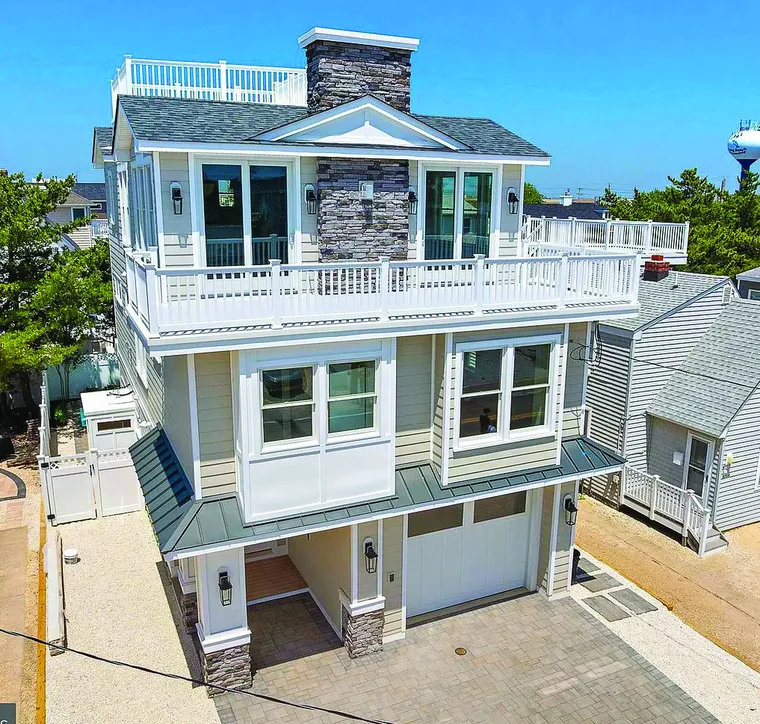
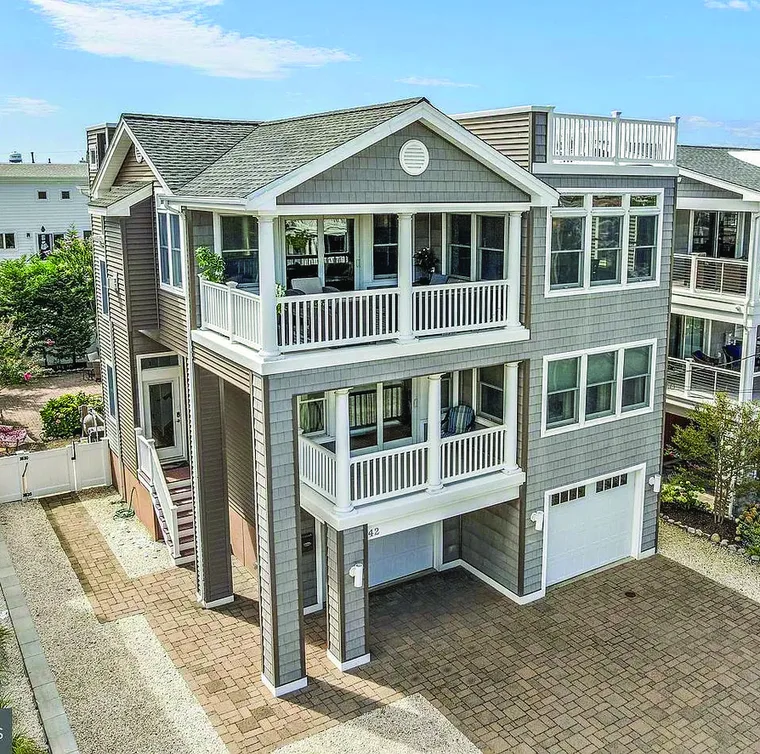
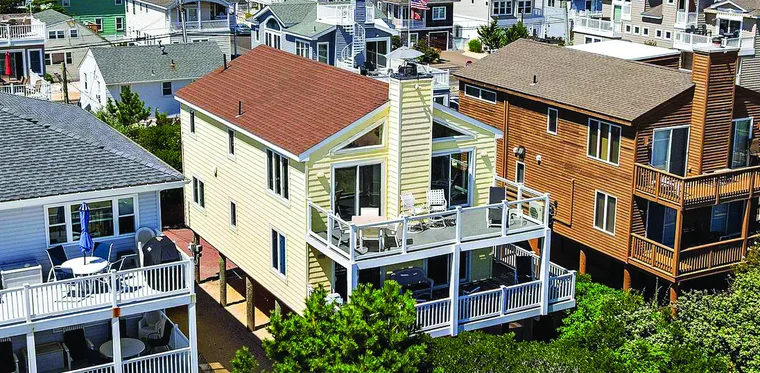
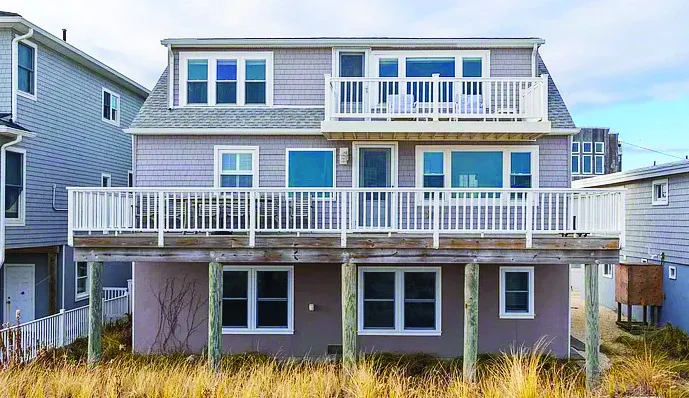
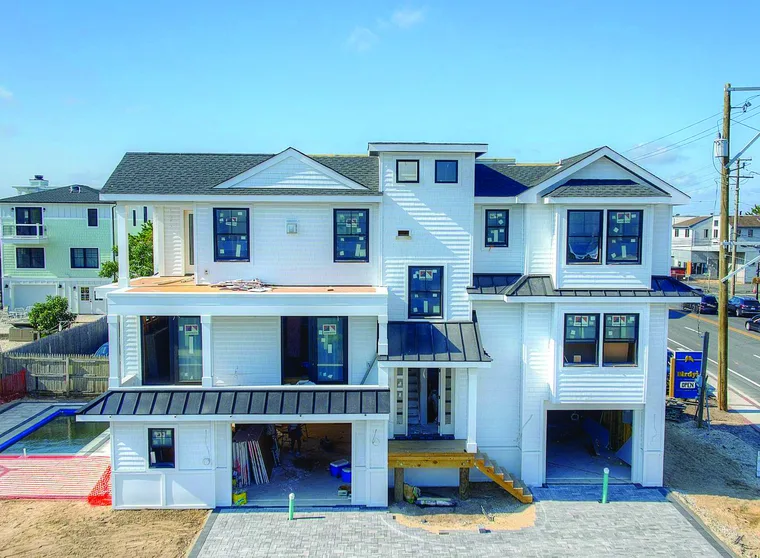
I appreciate the illustration of the appearance of wind turbines off our coast. However, another illustration is just as important – the appearance of LBI after several feet of sea level rise.
Luckily, there is an illustration of this, courtesy of NOAA. Go to coast.noaa.gov/slr/#/layer/slr and you will be able to zoom onto LBI and use a sliding scale to see the effects of different levels of sea level rise.
September 14, 2023
Subscribe to keep reading
This story is from our archive. Get your SandPaper Annual Pass for access to our digital archive, plus everything else a pass includes. Details below.
Annual Pass — $18 Details
365-day access to:
- The complete SandPaper digital archive (stories date back to 2012).
- Full photo galleries from our photographers.
- The entire catalog of SandPaper games, puzzles and quizzes.
How it works
- Enter your email below and click to pay the one-time $18. Card details are entered on Stripe’s secure page.
- You’re in straight away — no password to create, and nothing to set up or manage.
- You stay signed in. If you’re ever signed out, or you read on a new phone or computer, we’ll email you a code to get you back in.
- Never auto-renews. Your pass is good for one year. We will email you when it expires so you can renew if you’d like.
See our site policies for more information.
or sign in
Already a subscriber? We’ll email a code to get you back in.